COLUMBUS, Ohio, July 30, 2026 – American Electric Power (Nasdaq: AEP) today reported second-quarter 2026 GAAP earnings of $713 million or $1.31 per share, compared with GAAP earnings of $1,226 million or $2.29 per share in second-quarter 2025. Operating earnings for second-quarter 2026 were $742 million or $1.36 per share, compared with operating earnings of $766 million or $1.43 per share in second-quarter 2025. See the detailed GAAP to operating earnings reconciliation at the end of this press release.
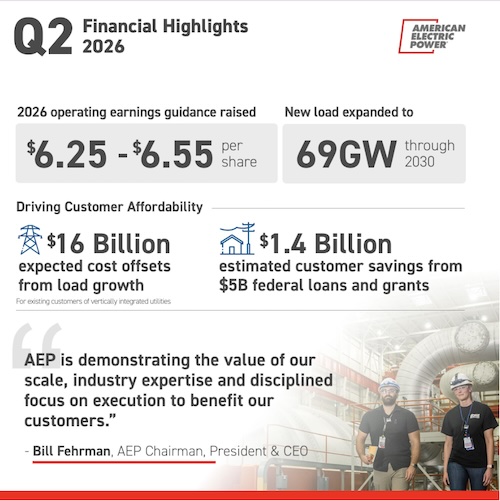
AEP is raising its full-year 2026 operating earnings guidance to $6.25 to $6.55 per share from its previous guidance range of $6.15 to $6.45 per share to reflect strong performance through the first half of the year and expected results for the remainder of the year. The company also reaffirmed its annual operating earnings growth rate of 7% to 9% through 2030, with an expected operating earnings compound annual growth rate (CAGR) of greater than 9%, based on the 2025 guidance midpoint and supported by AEP’s five-year, $78 billion capital plan. Additionally, AEP has line of sight to incremental capital investments of more than $10 billion, including the fuel cell project in Wyoming, the Piketon transmission opportunity in Ohio, and incremental generation in AEP’s footprint.
“While I recognize our operating earnings are below last year at this stage due to the 2025 transmission minority interest sale and the timing of tax-related items, I am highly confident in our robust business performance – so much so that we are raising 2026 full-year guidance to $6.25 to $6.55 per share,” said Bill Fehrman, AEP chairman, president and chief executive officer.
Affordability and Regulatory Progress
Affordability remains central to AEP’s customer-focused growth strategy. As new large load customers come online, they can help spread the fixed costs across a broader customer base. AEP has identified up to $16 billion in expected cost offsets for residential customers in its vertically integrated utilities that are supported by fully executed take-or-pay electric service agreements.
As an additional affordability measure, AEP continues to utilize grants and low-cost loans from the U.S. Department of Energy (DOE) to drive customer savings. Most recently, AEP Texas secured a DOE loan for up to $3.3 billion to support nearly 100 transmission projects, which is expected to save customers $685 million in interest costs over the life of the loan.
With this financing, AEP has now secured approximately $5 billion in DOE loans across its portfolio, supporting nearly $1 billion in projected customer savings through lower interest costs. Combined with almost $400 million in awarded DOE grants, this DOE funding is expected to deliver nearly $1.4 billion in estimated customer benefits over the life of the loans and grants.
AEP’s operating companies continued to deliver productive regulatory outcomes during the second quarter. These included approval of a distribution base rate decrease for customers in Ohio, approval to add 1.3 GW of generation resources for Oklahoma customers, and completion of a $1.4 billion securitization that allowed Appalachian Power to file its lowest increase in a base rate request in Virginia in nearly 30 years. Virginia also approved a large load tariff in the second quarter, bringing the total number of AEP’s states with approved large load tariffs to five, with three additional state filings pending approval.
“As electricity demand accelerates, we have seen firsthand how growth can lower costs and improve affordability for existing customers. That is why we have led efforts to implement large load tariffs and structure contracts to ensure growth helps pay for growth,” said Fehrman. “By leveraging our industry-leading transmission network, securing the resources needed to support reliability and future demand, and working with our regulators and policymakers to drive down costs for customers, we expect to strengthen our communities and create long-term value for all of our stakeholders.”
Accelerating Demand Drives Infrastructure Investment
AEP continues to see robust customer demand across its system and is making investments that support reliability, affordability and long-term value for customers, communities and shareholders. The company added an incremental six GW of signed load agreements during the second quarter, primarily in Texas, bringing total contracted load growth through 2030 to 69 GW. The agreements include a diverse set of customers, including hyperscalers, data centers and industrials.
Generation Strategy Advances to Support Growing Customer Base
Significant new generation is required to meet customer energy needs, and AEP has been an early mover to secure the resources needed to serve growing demand reliably.
During the second quarter, AEP secured three additional GW of gas-fired turbine capacity, bringing its total secured capacity to approximately 13 GW for potential deployment through 2031. AEP is also evaluating opportunities to obtain up to 10 GW of additional turbine capacity through 2035. This proactive approach provides greater visibility and flexibility in AEP’s generation planning and reinforces its ability to serve accelerating load growth across the footprint.
“AEP is demonstrating the value of our scale, industry expertise and disciplined focus on execution to benefit our customers,” said Fehrman. “We are building partnerships and making strategic investments in generation and transmission that support reliability and affordability while helping customers and communities capture the benefits of generational energy demand growth.”
American Electric Power
Preliminary, unaudited results
| Second Quarter Ended June 30 | |||
| 2025 | 2026 | Change | |
| Revenue ($ Millions): | 5,087 | 5,445 | 358 |
| Earnings ($ Millions): | |||
| GAAP | 1,226 | 713 | (513) |
| Operating (non-GAAP) | 766 | 742 | (24) |
| EPS ($): | |||
| GAAP | 2.29 | 1.31 | (0.98) |
| Operating (non-GAAP) | 1.43 | 1.36 | (0.07) |
| EPS is calculated using the weighted average basic common shares outstanding of 534 million and 544 million for the quarters ended June 30, 2025 and 2026, respectively | |||
| Year-to-Date Ended June 30 | |||
| 2025 | 2026 | Change | |
| Revenue ($ Millions): | 10,550 | 11,465 | 915 |
| Earnings ($ Millions): | |||
| GAAP | 2,026 | 1,587 | (439) |
| Operating (non-GAAP) | 1,589 | 1,633 | 44 |
| EPS ($): | |||
| GAAP | 3.80 | 2.92 | (0.88) |
| Operating (non-GAAP) | 2.98 | 3.01 | 0.03 |
| EPS is calculated using the weighted average basic common shares outstanding of 534 million and 544 million for the quarters ended June 30, 2025 and 2026, respectively | |||
Summary of Results by Segment
$ in millions, unaudited
| Second Quarter Ended June 30 | |||
| GAAP Earnings | 2Q 25 | 2Q 26 | Change |
| Vertically Integrated Utilities (a) | 433 | 284 | (149) |
| Transmission & Distribution Utilities (b) | 224 | 222 | (2) |
| AEP Transmission Holdco (c) | 578 | 225 | (353) |
| Generation & Marketing (d) | 62 | 97 | 35 |
| All Other | (71) | (115) | (44) |
| Total GAAP Earnings | 1,226 | 713 | (513) |
| Operating Earnings (non-GAAP) | 2Q 25 | 2Q 26 | Change |
| Vertically Integrated Utilities (a) | 297 | 302 | 5 |
| Transmission & Distribution Utilities (b) | 224 | 239 | 15 |
| AEP Transmission Holdco (c) | 224 | 225 | 1 |
| Generation & Marketing (d) | 92 | 91 | (1) |
| All Other | (71) | (115) | (44) |
| Total Operating Earnings (non-GAAP) | 766 | 742 | (24) |
| A full reconciliation of GAAP earnings to operating earnings is included in tables at the end of this news release.
a. Includes AEP Generating Co., Appalachian Power, Indiana Michigan Power, Kentucky Power, Kingsport Power, Public Service Company of Oklahoma, Southwestern Electric Power Company and Wheeling Power |
|||
| Year-to-Date Ended June 30 | |||
| GAAP Earnings | YTD 25 | YTD 26 | Change |
| Vertically Integrated Utilities (a) | 757 | 746 | (11) |
| Transmission & Distribution Utilities (b) | 389 | 459 | 70 |
| AEP Transmission Holdco (c) | 813 | 434 | (379) |
| Generation & Marketing (d) | 164 | 172 | 8 |
| All Other | (97) | (224) | (127) |
| Total GAAP Earnings | 2,026 | 1,587 | (439) |
| Operating Earnings (non-GAAP) | YTD 25 | YTD 26 | Change |
| Vertically Integrated Utilities (a) | 647 | 766 | 119 |
| Transmission & Distribution Utilities (b) | 416 | 476 | 60 |
| AEP Transmission Holdco (c) | 459 | 434 | (25) |
| Generation & Marketing (d) | 168 | 181 | 13 |
| All Other | (101) | (224) | (123) |
| Total Operating Earnings (non-GAAP) | 1,589 | 1,633 | 44 |
| A full reconciliation of GAAP earnings to operating earnings is included in tables at the end of this news release.
a. Includes AEP Generating Co., Appalachian Power, Indiana Michigan Power, Kentucky Power, Kingsport Power, Public Service Company of Oklahoma, Southwestern Electric Power Company and Wheeling Power |
|||
Earnings Guidance
AEP management raised its 2026 operating earnings guidance range to $6.25 to $6.55 per share. Operating earnings, which could differ from earnings reported in accordance with GAAP, exclude certain gains and losses and other specified items that management believes are not indicative of AEP’s ongoing performance. AEP management is not able to forecast if any of these items will occur or any amounts that may be reported for future periods. Therefore, AEP is not able to provide a corresponding GAAP equivalent for earnings guidance at this time.
Reflecting certain items recorded through the second quarter, the estimated earnings per share on a GAAP basis would be $6.16 to $6.46 per share. See the table below for a full reconciliation of 2026 earnings guidance.
| Estimated GAAP EPS Guidance | $6.16 | to | $6.46 |
| Mark-to-Market Impact of Commodity Hedging Activities | 0.03 | ||
| Impact of WVPSC Order | (0.07) | ||
| Pirkey Plant Partial Disallowance | 0.06 | ||
| Unified Tracker Mechanism Partial Disallowance | 0.04 | ||
| Wholesale Customer Contract Agreements | 0.04 | ||
| Income Tax Effect of Adjustments | (0.01) | ||
| Operating EPS Guidance | $6.25 | to | $6.55 |
Webcast
AEP’s quarterly discussion with financial analysts and investors will be broadcast live over the internet at 9 a.m. Eastern today at http://www.aep.com/webcasts. The webcast will include audio of the discussion and visuals of charts and graphics referred to by AEP management. The charts and graphics will be available for download at http://www.aep.com/webcasts.
AEP reports its financial results in accordance with GAAP. AEP supplements its reporting of financial information with certain non-GAAP financial measures, such as operating earnings and operating earnings per share. The most comparable GAAP measure to operating earnings and operating earnings per share is GAAP earnings and GAAP earnings per share, respectively.
This information is intended to enhance an investor’s overall understanding of period over period financial results and provide an indication of AEP’s baseline operating performance by excluding items that are considered by management to be not directly related to the ongoing operations of the business. In addition, this information is among the primary indicators management uses as a basis for evaluating performance, allocating resources, setting incentive compensation targets and planning and forecasting of future periods. These non-GAAP financial measures are not a presentation defined under GAAP and may not be comparable to other companies’ presentations. These non-GAAP measures should not be deemed more useful than, a substitute for, or an alternative to the most comparable GAAP measures.